A solo project, currently in beta

Host your services.
Not your monitoring.

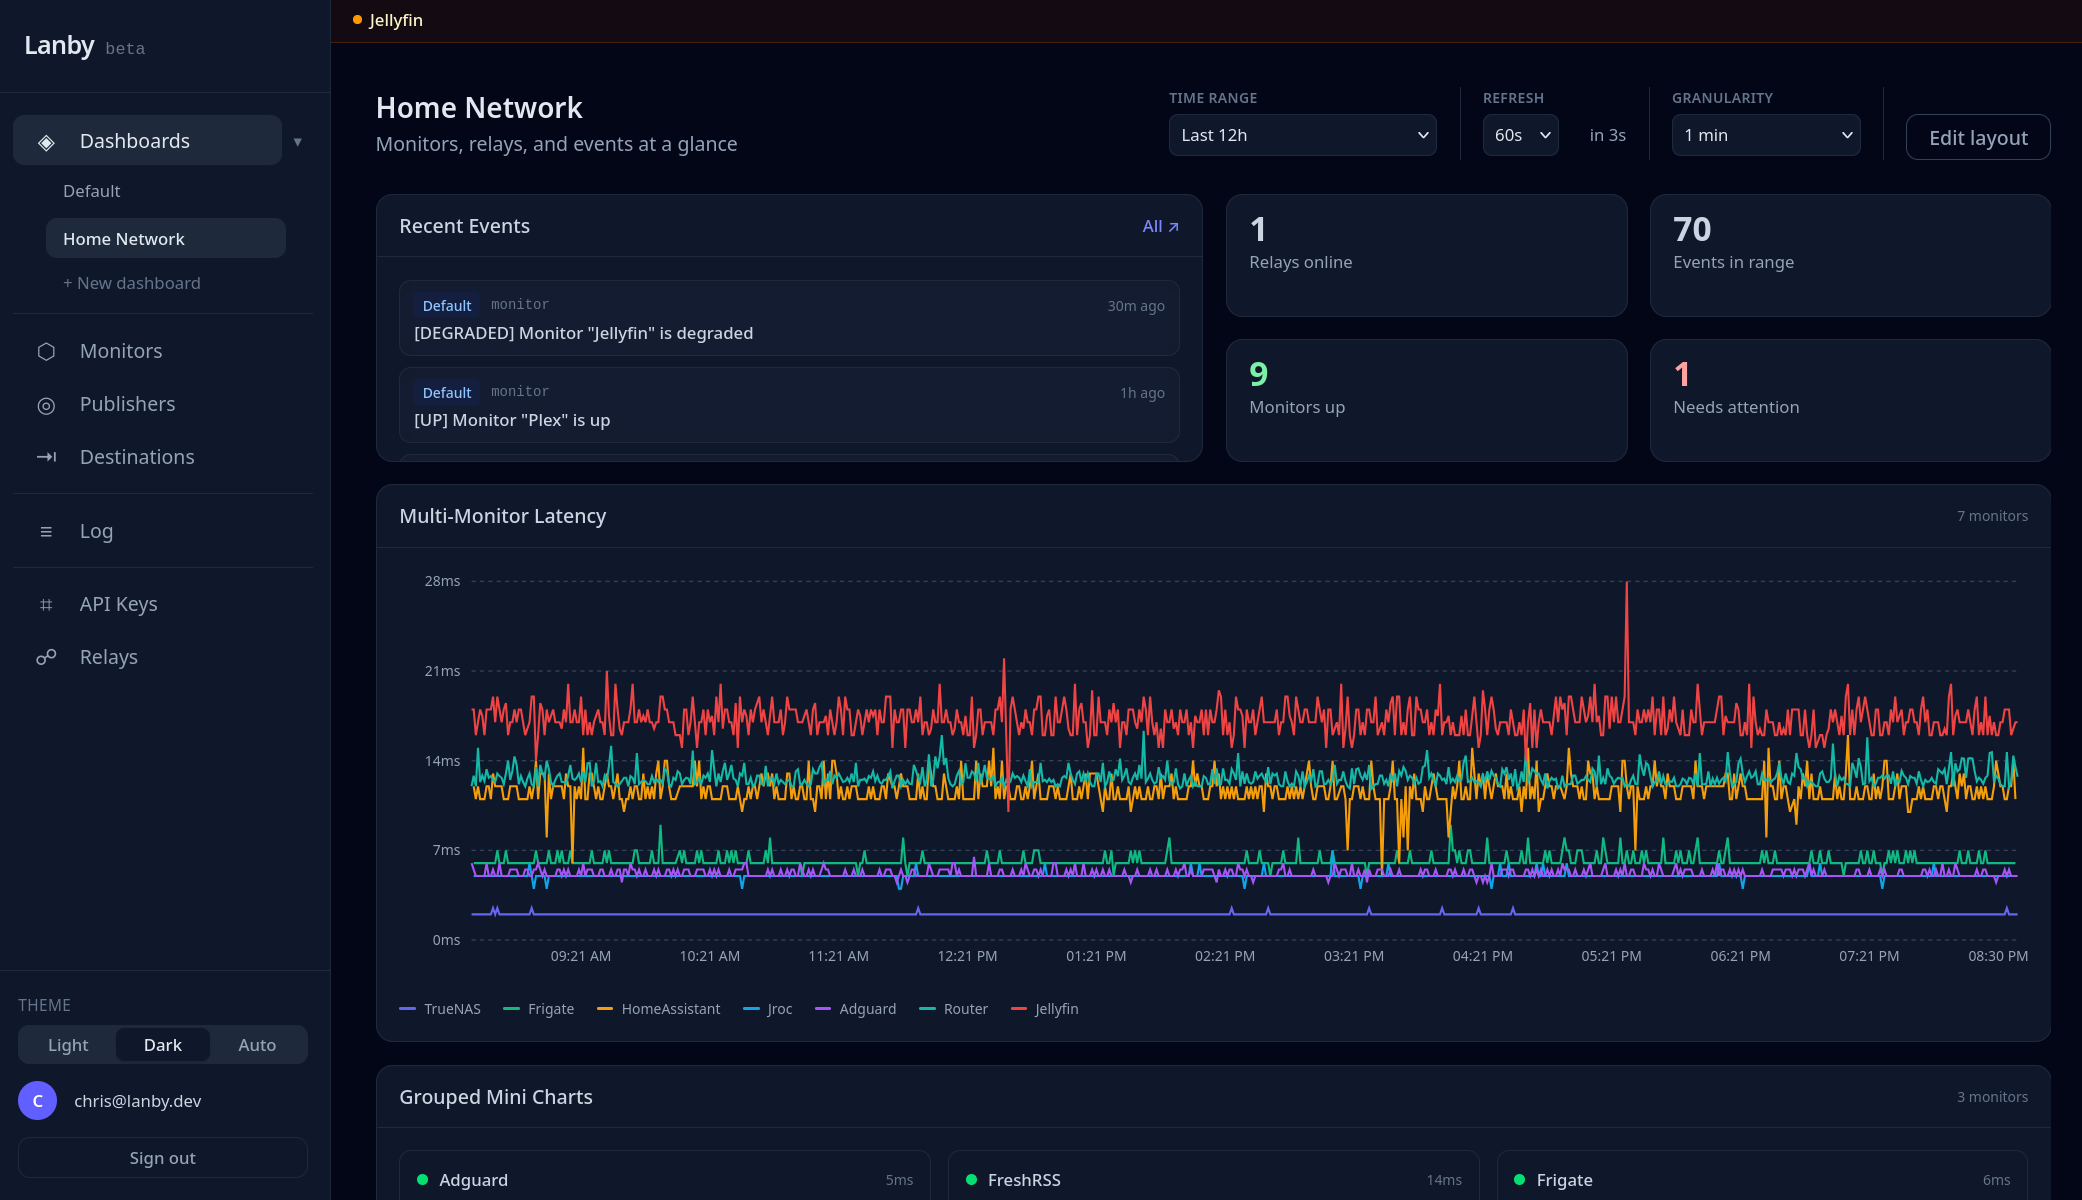
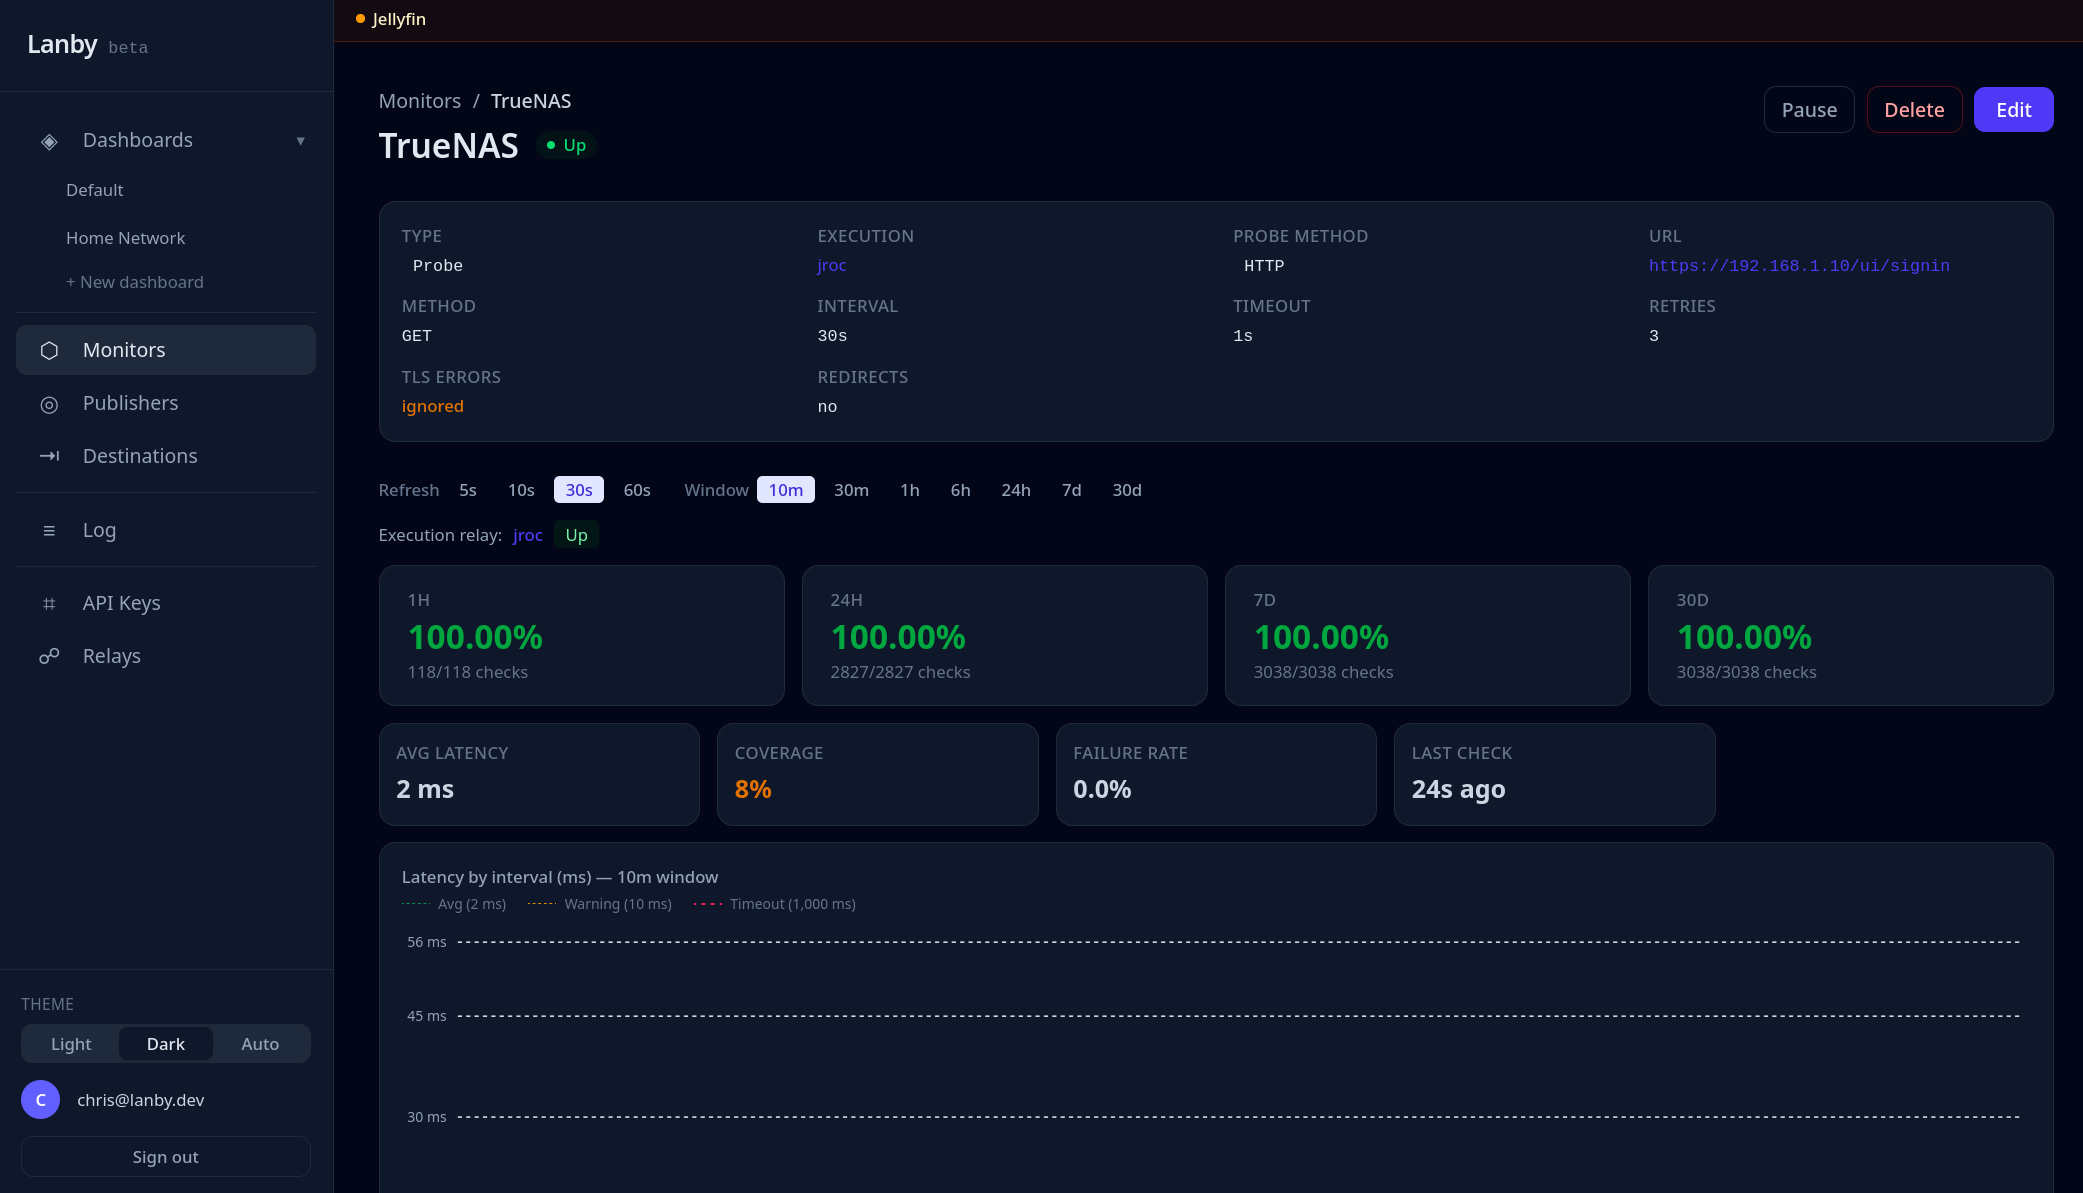
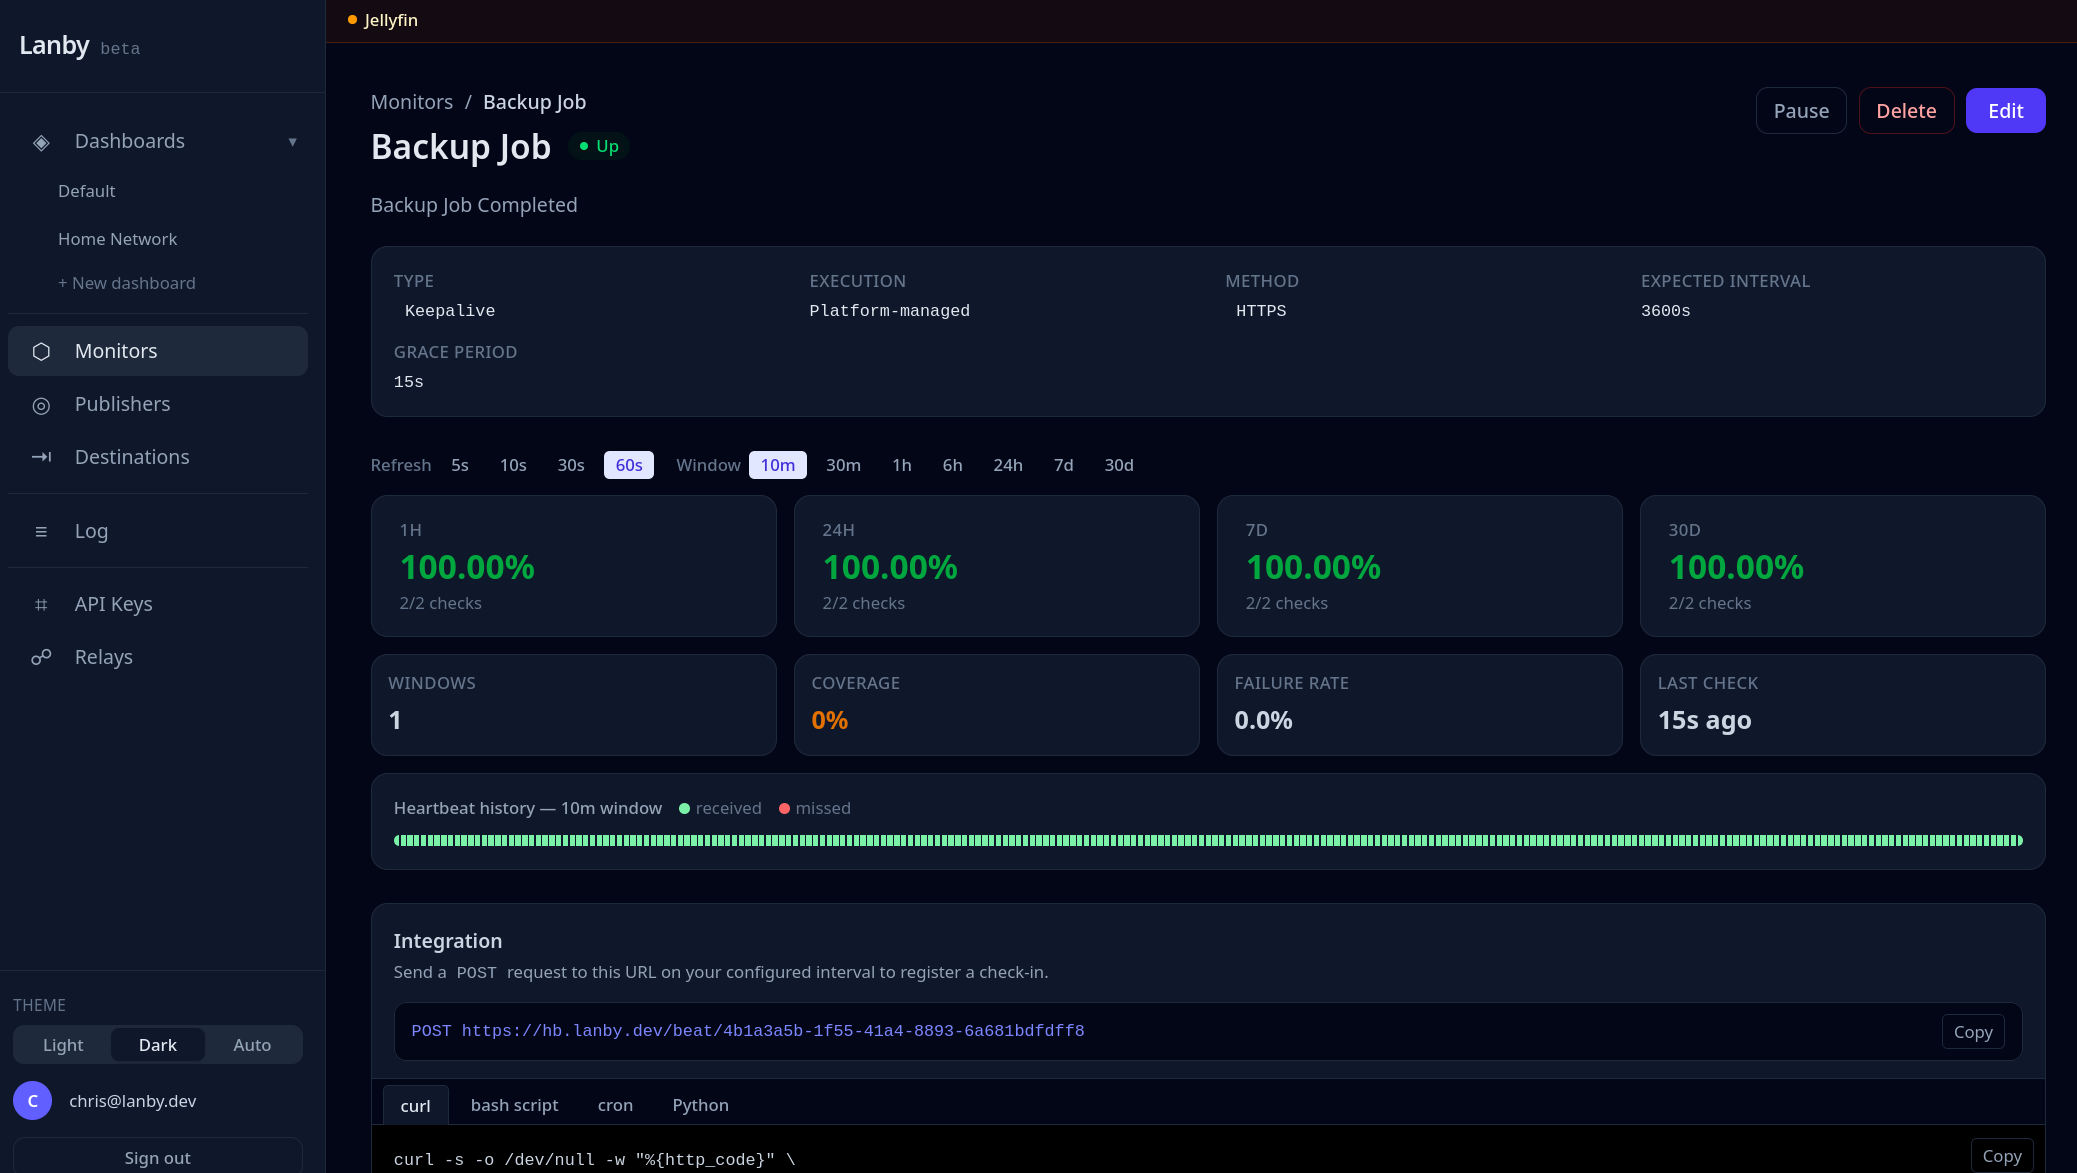
I run a lot of self-hosted services and kept finding out things were broken long after the fact. Tools like Uptime Kuma are great, but now you're hosting your monitoring too — and if that goes down, you're back to square one. Uptime probes, heartbeat alerts, and a relay that reaches everything behind your firewall — no inbound ports needed.

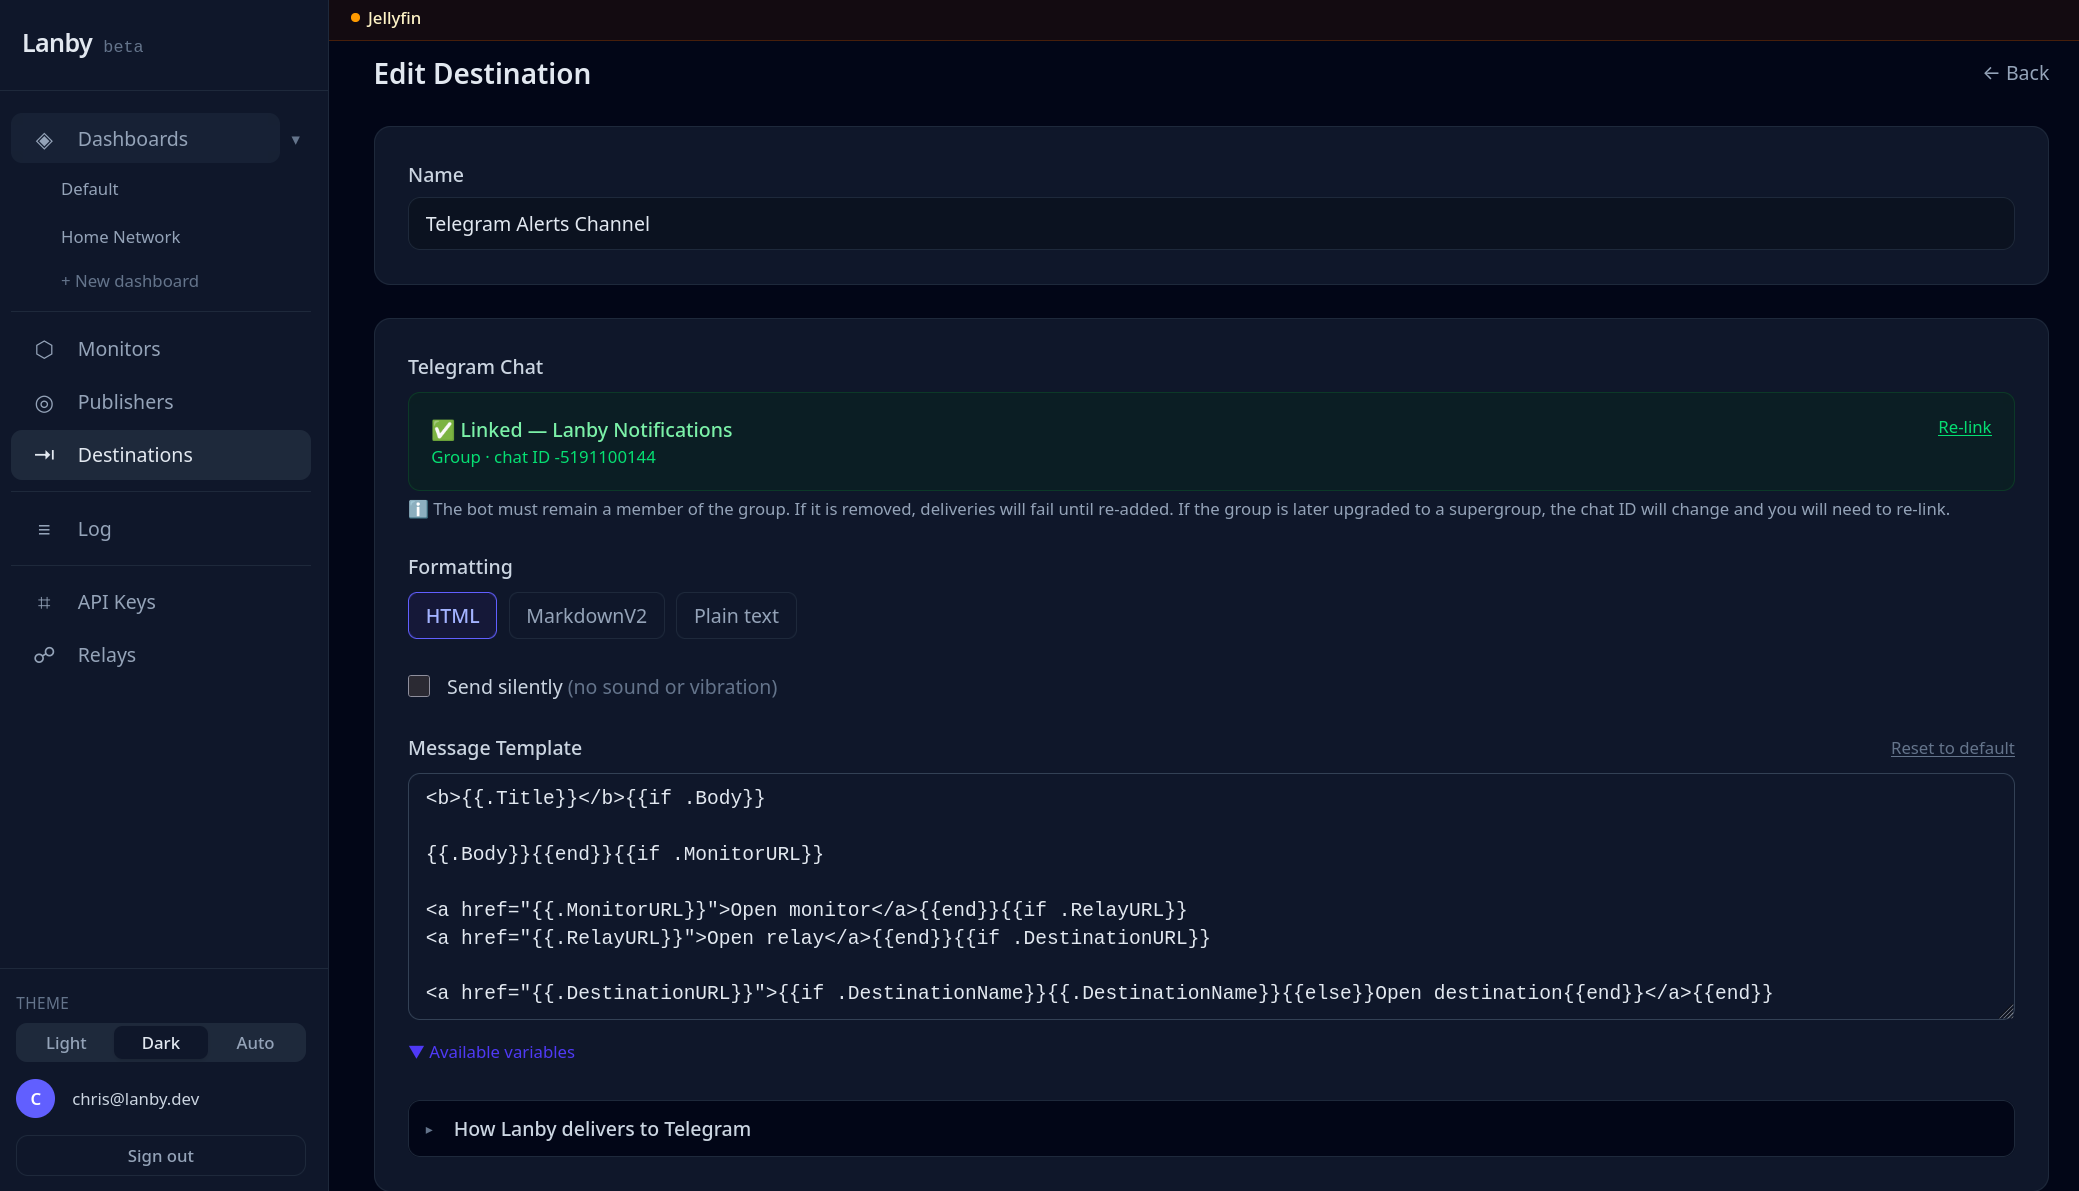
Invite-only for now. Want early access? Join the beta.

app.lanby.dev
MONITORING
Dashboard
Monitors
Relays
DELIVERY
Notifications
Destinations
3
UP
1
DOWN
1
DEGRADED
142ms
AVG RESP
api.production
probe · api.prod.example.com
UP
worker.01
keepalive · 2m overdue
DEG
ingest.eu
probe · in.eu.example.com
DOWN

What it does

Active probes check your services from outside, the relay checks from inside your network, and alerts go to wherever you're already paying attention.

Monitoring

Active probes and passive heartbeats covering every layer of your stack — HTTP endpoints, open ports, DNS records, gRPC services, and long-running processes that should check in on a schedule.

HTTP / HTTPS TCP port ICMP ping DNS gRPC health TLS cert expiry Keepalive heartbeat

Alerts

Get notified the moment a monitor goes down or recovers. Route alerts to webhooks, Telegram chats, or any destination you configure — with per-monitor topics so the right alert reaches the right place.

Webhooks Telegram Topic routing Priority levels

Event publishing

Send events from any script, cron job, or application with a single API call — backup completions, deploy hooks, scheduled task results. Routed to the same destinations as your monitor alerts.

REST API Cron jobs Scripts & apps Dead-letter queue
Overview

Your whole stack, at a glance

The fleet dashboard shows every monitor's current status, recent check history, and response-time trends — all updating live. Spot a degraded service the moment it starts struggling, not after users start complaining.

Lanby fleet dashboard showing monitor status and latency trends
Monitor detail

When it went down and how long it took

Drill into any monitor for a full response-time chart, uptime percentage, and a log of recent check results. Every data point is timestamped so you can correlate incidents with deploys or other changes.

Lanby monitor detail showing uptime stats and latency chart
Heartbeat monitoring

Know when a job stops running

Heartbeat monitors expect a check-in on a schedule — from a cron job, backup script, or any process. Miss a window and Lanby fires an alert. This is how you find out a backup silently stopped running, not three weeks after the fact.

Lanby heartbeat monitor showing check-in history and integration code
Alerts

Alerts go where you're already looking

Configure destinations once — Telegram, webhooks, or whatever you use — then route monitors to them by topic. Critical alerts can go to one place, lower-priority ones somewhere else. No new inbox to check.

Lanby destination configuration for Telegram with message template

Things I use it for

Not an exhaustive list — just the stuff that actually comes up when you're running a bunch of services.

⏱️

Cron job monitoring

Send a heartbeat after each successful run. Miss a window and Lanby fires an alert. This is how I know my backups actually ran.

🌐

External endpoint checks

HTTP probes checking status codes and response content from outside your network. TLS certificate expiry is checked on every probe — get alerted before a cert expires.

🔌

Non-HTTP services

TCP and ping probes for databases, game servers, local DNS — anything that doesn't speak HTTP but still needs to be up.

📣

Script & job events

One API call from a backup script or deploy hook — delivered to wherever you're already looking. Same routing as monitor alerts.

The relay

Lanby's platform probes run from the internet. That works for public services, but breaks down for anything on a private network — a NAS, a database, a service behind a VPN. The relay is a Docker container you run inside your own network. It polls Lanby for assigned monitors, runs the probes locally, and POSTs the results back. Your firewall doesn't change.

Lanby monitor config + result store Relay your network Docker container Internal services Databases / TCP DNS / ICMP ① poll (HTTPS) ② probe config ③ local probes ④ POST results (HTTPS)

The relay polls for due monitors, runs probes inside your network, then POSTs {success, latency_ms, error} back over HTTPS. No inbound traffic, ever.

Security model

  • No inbound portsThe relay does not listen on any port. There is nothing reachable from outside your network — not from Lanby, not from anyone else.
  • Outbound HTTPS onlyAll communication is initiated by the relay over port 443. Same traffic profile as a package manager update.
  • Results only, never payload dataThe relay sends pass/fail, latency, and error strings. Response bodies stay inside your network. Lanby never sees your services' actual traffic.
  • Unprivileged containerNo --privileged flag, no host networking, no extra kernel capabilities. Runs as a normal unprivileged process.
  • Claim codes are one-time and account-scopedA relay can only be claimed by someone logged in to your account. The code is single-use and only printed to local logs.
  • TLS certificate expiry on internal servicesThe relay checks certificate validity and days-to-expiry on every HTTPS probe. Get alerted before an internal cert expires — even for services never exposed to the internet.

What it needs to run

  • DockerAny recent version. Compose works too.
  • Outbound port 443To reach api.lanby.dev. No other outbound rules required.
  • Network access to probe targetsThe relay needs to reach whatever you're asking it to check — same as running a curl or ping from that machine.
  • A persistent volumeStores the identity file so the relay reconnects to your account automatically after restarts without re-claiming.
ℹ️ One relay covers an entire network segment. You don't need a relay per host — just one per network that isn't reachable from outside.
Full relay documentation →

What I'm building next

Roughly in order. Some of this is nearly done; some is still figuring itself out.

Nearly there

Status pages

Public and private status pages driven by your monitors. Share a live view with users without handing them your dashboard.

Planned

More alert destinations

ntfy and Gotify are the obvious next ones for self-hosters. Slack, Discord, and email after that.

Planned

Self-hosted app integrations

Native integrations with Home Assistant, Vaultwarden, Authentik, and Portainer — no webhook glue required.

Planned

Service tunneling

Expose a specific internal service to a trusted user without opening firewall ports. Still figuring out the right shape for this one.

Eventually

Mobile apps

Push notifications and a quick status view on your phone. Makes sense — just not the most urgent thing right now.

Join the beta

Lanby is invite-only while I build it out. To request access, join the Discord server and post a message in the #beta channel — tell me what you're running and what you want to monitor.

If accepted, you'll receive an email invite. No spam — just the one email when your spot is ready.

Join the Discord →